Methane Emissions from Two Main Sources says UT Study

alt="Methane Emissions"

A new study led by researchers from The University of Texas hopes to provide clues to better understand the correlation between well technology and methane emissions during the natural gas production process.

The findings, published December 9th in Environmental Science & Technology, indicate that the overwhelming majority of methane emissions are from two types of wells; those that use pneumatic devices and those that use liquid unloading.

According to the study, 19% of Pneumatic Devices were responsible for 95% of methane emissions and were highest in the Gulf Coast Region, which was a similar result to the first part of the study conducted in 2013. As for Liquid Unloading, 20% of these devices account for 65-85% emissions. Conversely, this finding showed emissions were highest (~50%) in the Rocky Mountain Region due to the higher number of wells that utilize Unloading.

David Allen, principal researcher and professor at Cockrell School gives some perspective on the findings by sharing that “over the past several decades, 10 percent of the cars on the road have been responsible for the majority of automotive exhaust pollution,” said Allen. “Similarly, a small group of sources within these two categories are responsible for the vast majority of pneumatic and unloading emissions at natural gas production sites.

Hopefully this study, and others like it, will provide important data to help industry leaders as they work to create solutions to the growing concern over methane emissions in the Bakken and around the country.

To view a full research summary, visit Cockrell School of Engineering.

Bakken Natural Gas - Too Much of a Good Thing?

Bakken Oil Well
Bakken Oil Well

The oil & gas renaissance in the U.S. has nearly catapulted the country to the top spot for oil production in the world, and most experts believe the U.S. will hit this target by next year. But is it possible that the country and the Bakken has too much of a good thing? When it comes to natural gas that may be the case.

According to the BP 2014 statistical world energy review, the U.S. is currently the top natural gas producing country in the world at 328 Bcf/d. Over the past five years, natural gas production has grown over 20% in the U.S., thanks in large part to the shale revolution. But the price of natural gas has struggled to break $4/mmbtu, and oil companies in North Dakota's and Montana's Bakken Shale and the Eagle Ford Shale in South Texas have flared much of their produced natural gas in favor of capturing oil, which is a much higher valued commodity. Currently, the WTI price of crude oil is hovering around $95/bbl.

In North Dakota, where production from the Bakken Shale is highest, the state flares just under 30% of its produced natural gas. Recently, the first of several new rules has been enacted in the state to combat flaring. The North Dakota Industrial Commission (NDIC), the state's regulatory body for the oil and gas industry, hopes to capture 90% of Bakken natural gas by 2020; however, serious infrastructure improvements, including gas gathering systems and natural gas pipelines will need to be implemented in the Williston Basin for this goal to be achieved. The alternative could mean operators will need to shut-in wells to meet flaring guidelines - that's bad news for them, the state and mineral owners.

Read more: NDIC Implements New Bakken Flaring Rule - June 1, 2014

What this boils down to is the U.S. has an abundance of natural gas, which is a good thing. The bad thing is the country lacks the infrastructure to capture all of it.

With world usage of natural gas accounting for 24% of all primary energy consumed, there is decidedly a market for natural gas. But the only effective way to transport natural gas to foreign markets is to liquify it, which is costly. Ultimately, natural gas production is subject to the free market. As long as the price stays low, there's less economic benefit for operators to produce it, and companies to transport it and market it.

ND Oil Production On Pace for More than 1 Million b/d by Year-end

EIA Bakken Oil Graph Oct 2013

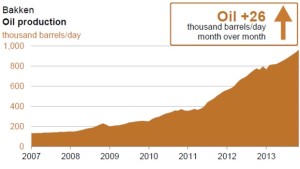
North Dakota oil production is on pace to eclipse 1 million b/d by year-end. The state reported production of ~932,000 b/d in September and is expected to add between 20,000 and 30,000 b/d each month going forward.

ND natural gas production set a new record at 1.06 bcf/d.

The state should also eclipse 10,000 producing wells before year-end. The real risk to any of the above trends is snow and cold weather.

Other takeaways include:

  • 207 wells were completed in September - up from 153 in August
  • One well is getting completed for every 1.5 drilled
  • Time from spud to first production held at ~100 days
  • >95% of drilling targets the Bakken and Three Forks
  • Natural gas prices near Watford City are trading near $3/mcf

Read the full director's cut at dmr.nd.gov

North Dakota Reports Record Production Volumes in August 2013

Bakken Production Chart - Goldman Sachs

North Dakota oil production increased 4% from a little more than 875,000 b/d in July to more than 911,000 b/d in August. Natural gas production rose ~3% and eclipsed 1 Bcf/d for the first time.

That means North Dakota accounts for more than 15% of all the oil produced and 1.5% of all the natural gas produced in the onshore U.S.

Largest Monthly Bakken Production Increase Ever in July

Bakken production increased by more than 4% or ~35,000 b/d in in August to reach 847,000 b/d. That represents significant growth over volumes of ~638,000 b/d in August 2012 and ~379,000 b/d in August of 2011.

Other notes from the August monthly NDIC Director's Cut include:

  • 287 wells were permitted
  • 9,452 wells producing
  • Average crude oil price of ~$93/bbl in August
  • Completions fell from 251 in July to 130 in August
  • Time from spud to total depth averaged 22 days
  • Time from spud to first completion rose from 79 to 105 days
  • About 450 wells are waiting to be completed

August completion levels falling should not be alarming. July completion figures were inflated by bad weather and other completion delays in prior months.

Read the full director's cut at dmr.nd.gov